
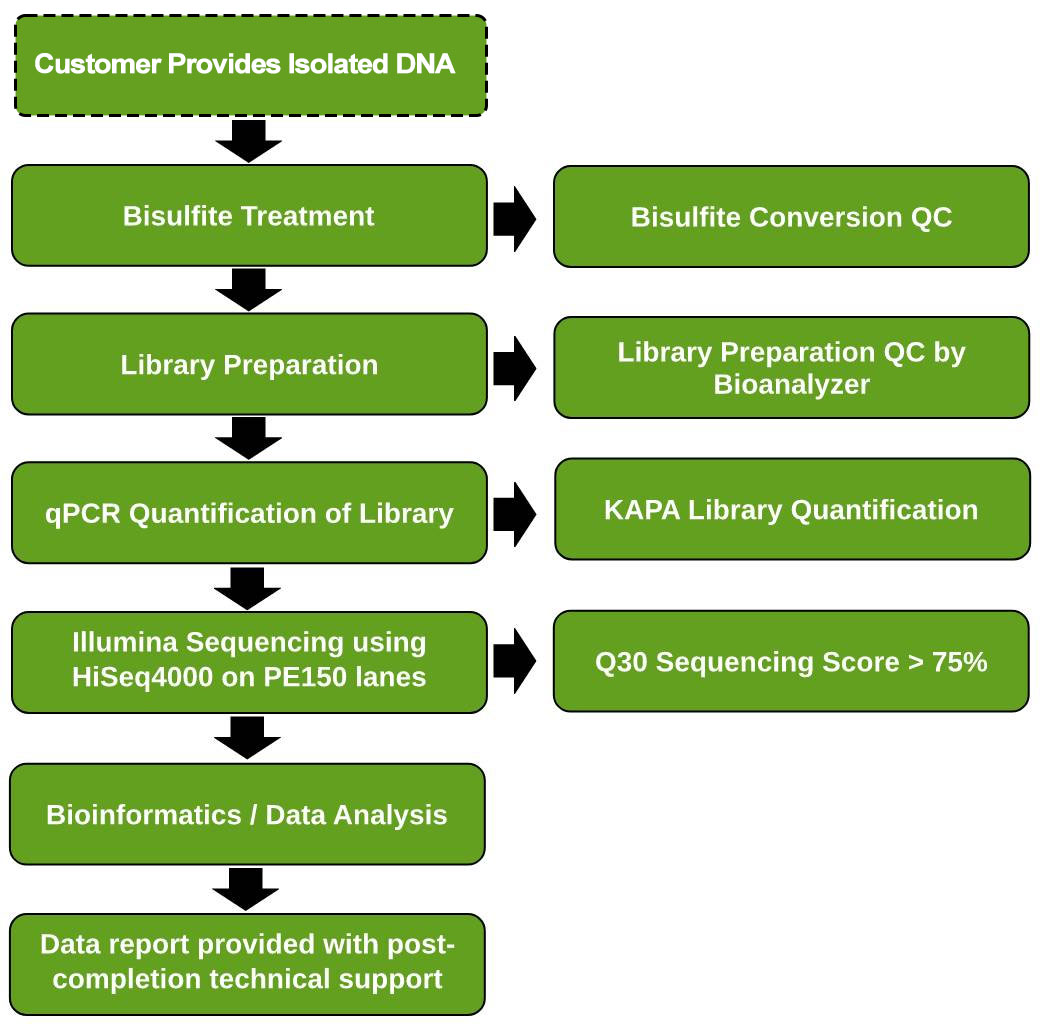
Whole Genome Bisulfite Sequencing (WGBS) is a bisulfite sequencing method to detect in-depth DNA methylation across the entire genome, including methylation at CpG sites and less common non-CpG site such as CNG.
WGBS is the gold standard for bisulfite based DNA methylation studies as the entire genome is sequenced with base-level detail into where every methylated cytosine is located.
Example Data
*These are examples of data that may be provided. Please consult your service representative regarding the exact data you will receive.
-

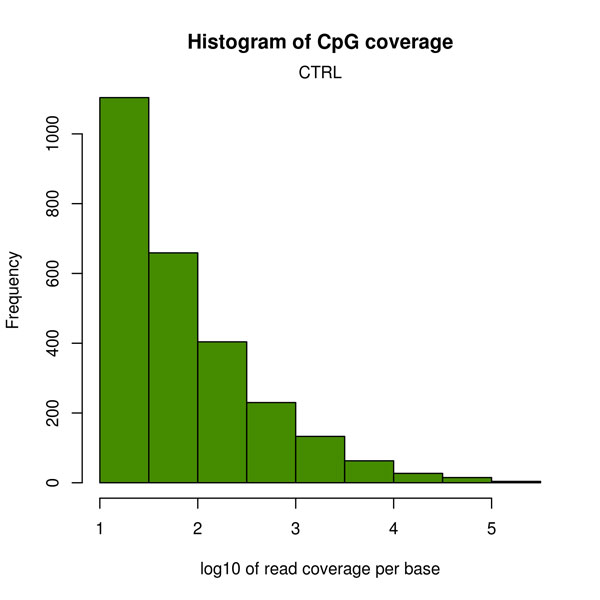
- Histogram CpG site coverage of sample set using EpiGentek’s DNA Methylation Analysis services.
-

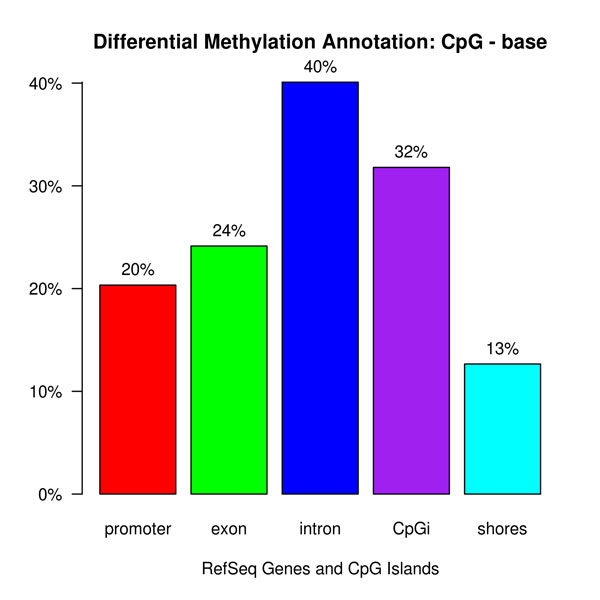
- Differential methylation annotation provides a bar chart of differentially methylated sites overlapping with genomic features (promoters, exons, introns, CpG islands, and CpG shores
-
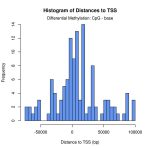
- Histogram distance TSS provides distances of differentially methylated sites to the nearest transcription start site.

-
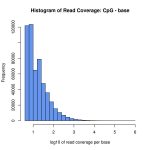
- A histogram of average read depth coverage for EpiGentek’s DNA Methylation Analysis services.

-
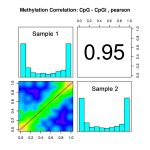
- Methylation correlation provides sample correction shown in scatter plots (lower left) and correlation coefficients (upper right).

-
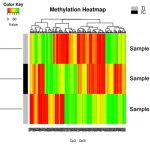
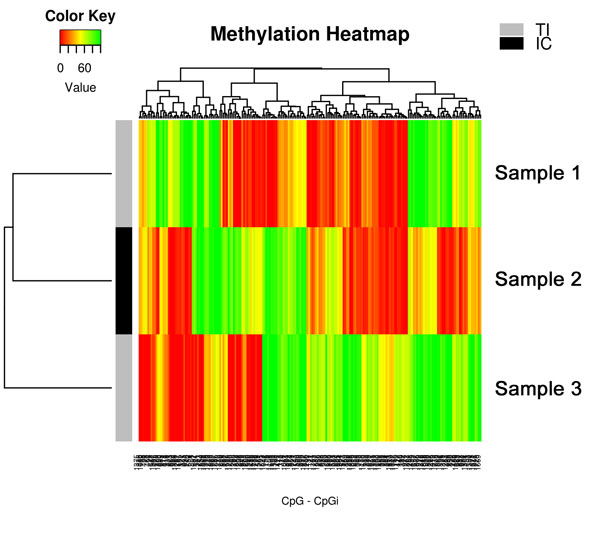
- The Methylation Heatmap offers statistical grouping and visualization of samples based on DNA methylation levels of CpG sites. Green = 100% methylated; Red = 0% methylated.
-
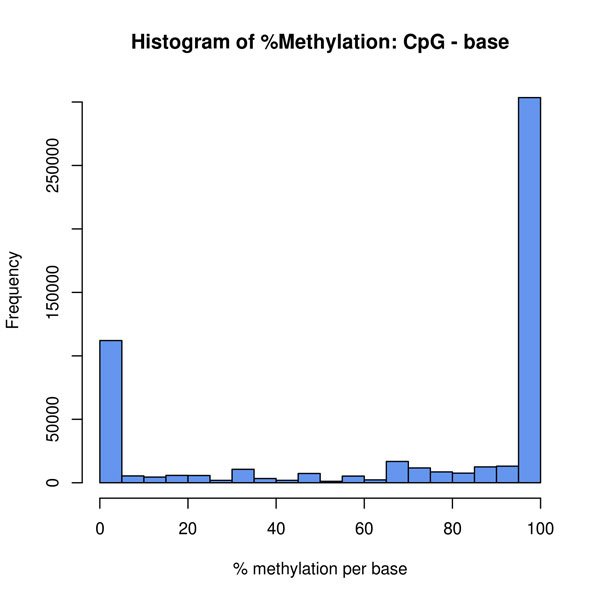
- Histogram % CpG methylation provides CpG methylation distribution within sample. Normally there should be two peaks at both ends.
-
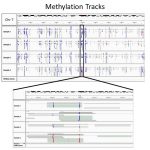
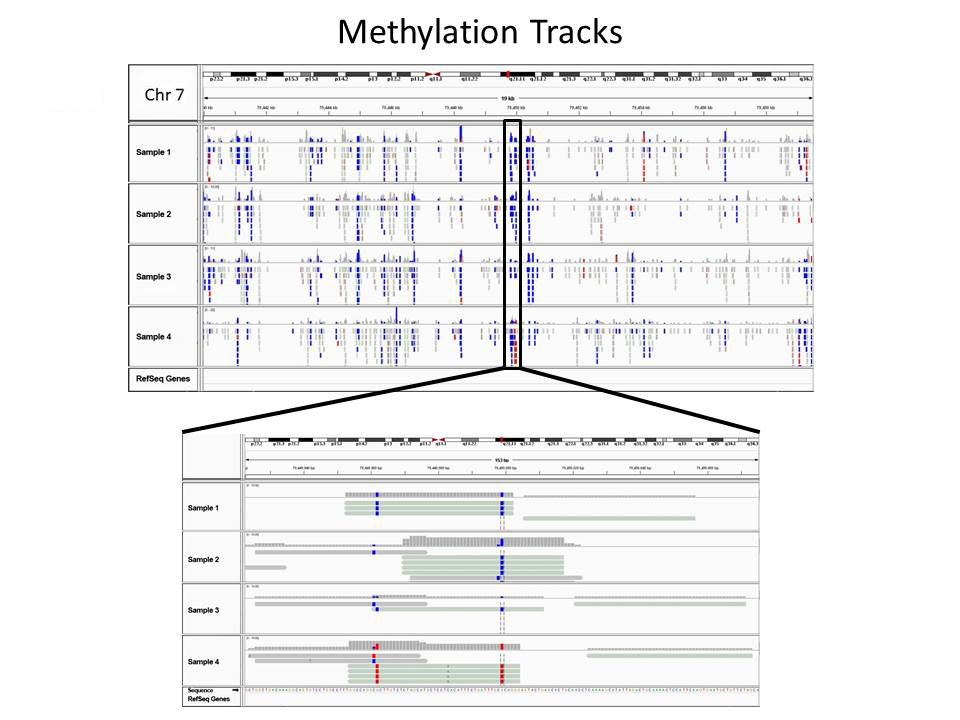
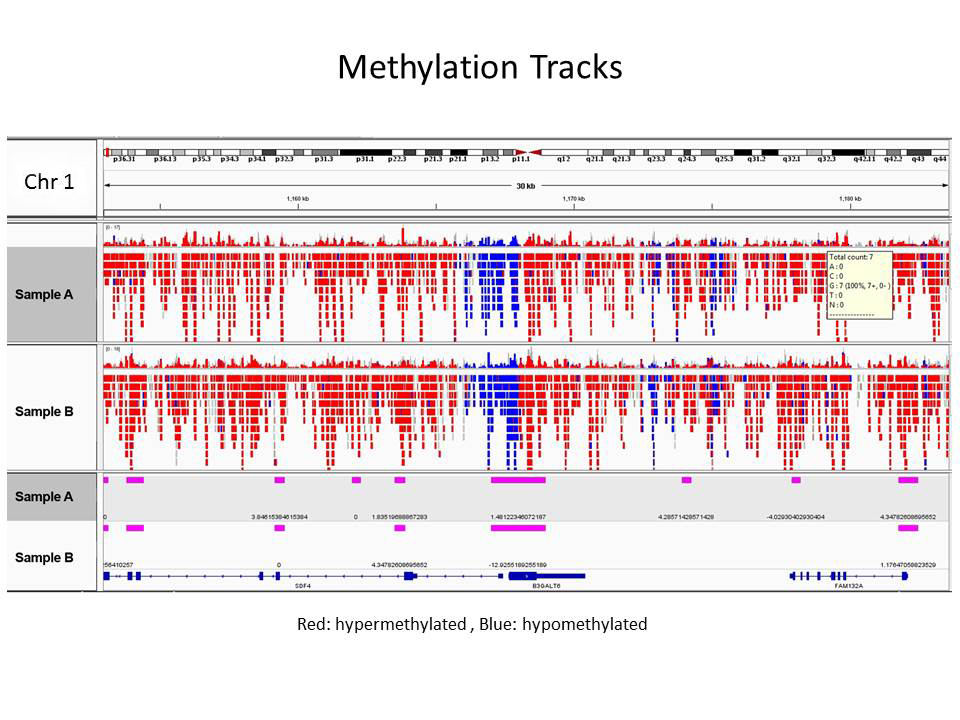
- Read alignment views of DNA Methylation Analysis data at 19 kb and base pair resolution in chromosome 7 using Integrative Genomics Viewer (IGV). The data shows CpG methylation differences for treated and control samples. Control samples are unmethylated (blue) while treated samples are methylated (red).
-
- The Methylation Heatmap offers statistical grouping and visualization of samples based on DNA methylation levels of CpG sites. Green = 100% methylated; Red = 0% methylated.
-
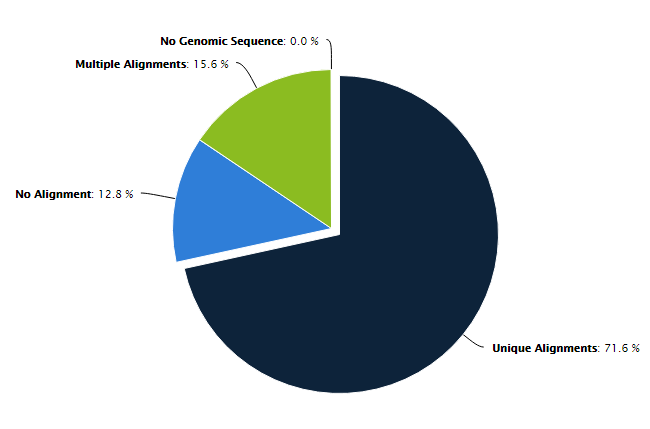
- Bismark Mapping aligns bisulfite treated sequences to a genome of interest and will output comprehensive methylation data that can be visualized in a genome viewer or used for further analysis.
-
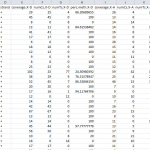
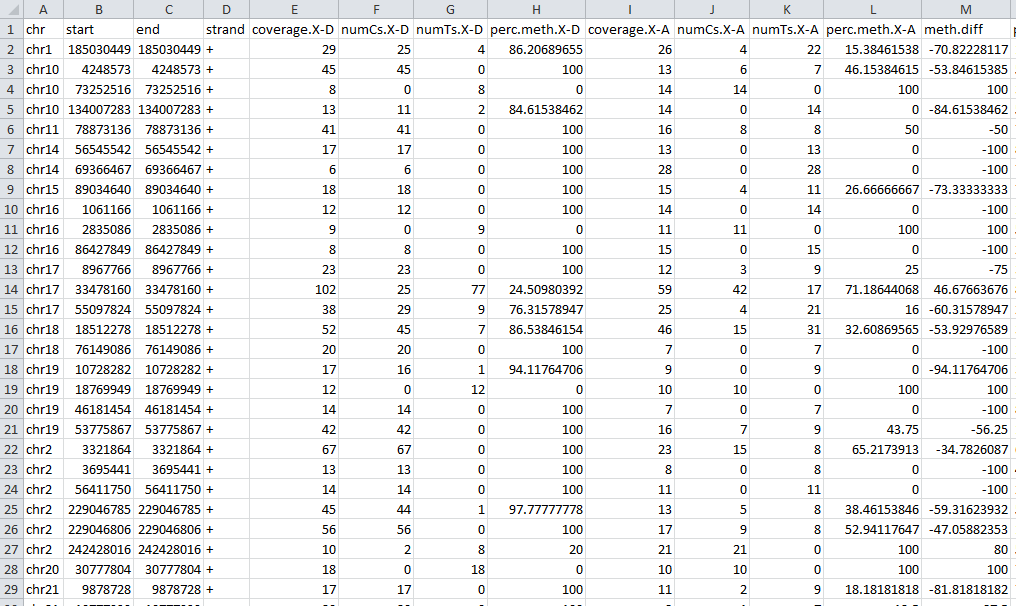
- Results Tables provide information about individual CpG sites and the frequency of methylation in addition to differential methylation analysis results. For each particular base, the methylation difference value is given along with methylation status as hyper- or hypo- methylated, as well as the chromosomal position and pvalue.
-
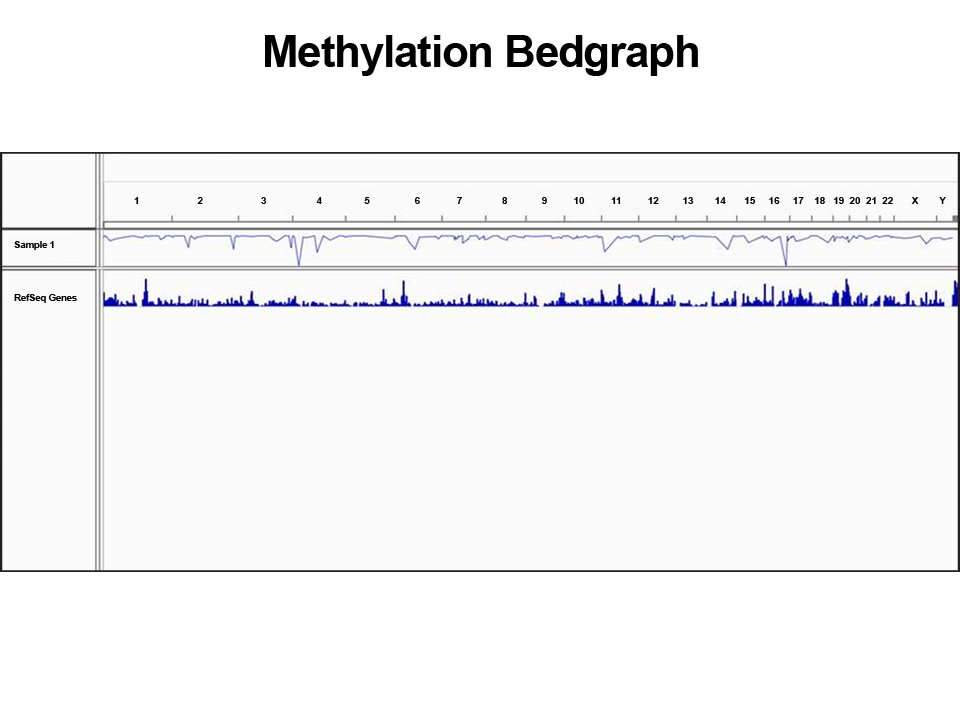
- The Methylation Bedgraph allows quick visual comparison of DNA methylation for each chromosome in the genome.
Sample Requirements
We currently accept DNA, cell, and tissue samples for our Whole Genome Bisulfite Sequencing Methyl-Seq service. Proper sample preparation along with the appropriate quality control methods on your end will allow the greatest chance for assay success. Please follow all guidelines for sample requirements, packaging and labeling, and shipping which are outlined on the Submission Instructions page.
Talk to a Scientist

Want more information on our Whole Genome Bisulfite Sequencing Methyl-Seq service or interested in customizing your research project? We’re here to help! Get in touch with one of our highly knowledgeable epigenetic services experts by calling toll-free at 1-877-374-4368 or emailing services @ epigentek.com.