
Genome-wide, base resolution DNA methylation analysis is now made easy using our comprehensive Methyl-Seq bisulfite sequencing services. Our next-generation sequencing platforms can deliver a great amount of useful DNA methylation information with publication-ready data parsed by our expert bioinformatics scientists. The study of methylation at single base resolution of individual cytosines in DNA is facilitated by bisulfite treatment of DNA followed by PCR amplification, cloning, and sequencing of individual amplimers. EpiGentek’s Methyl-Seq platform uses Targeted Bisulfite Sequencing, Reduced Representation Bisulfite Sequencing (RRBS) or Whole Genome Bisulfite Sequencing (WGBS) to yield reliable information on the methylation states of individual cytosines by effectively and efficiently preparing converted DNA for use in next generation sequencing techniques and offers the following advantages:
- Complete conversion (>99.9%) and maximum recovery of bisulfite-converted DNA
- Minimal selection bias, allowing for a low amount of input material high yield of the constructed DNA library, and low error rates
- Streamlined process for rapid turnaround time (4-8 weeks)
- Multi-stage quality control check including Bioanalyzer library QC and KAPA qPCR quantification
- Q30 > 75% sequencing score guaranteed
- End-to-end service with bioinformatics included at no additional charge
- Delivery of high-quality, publishable data
- Receive full deliverable package including Illumina FASTQ raw sequencing files, FastQC quality control insight, Bismark read mapping, methylation calling data, differential methylation analysis, and methylation region annotation
- Post-completion technical support to assist with data analysis
Limited Time Special Offer: Receive our Enhanced RRBS service for just $539 / sample (with minimum 12 samples per lane)
Example Data
*These are examples of data that may be provided. Please consult your service representative regarding the exact data you will receive.
-
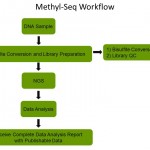
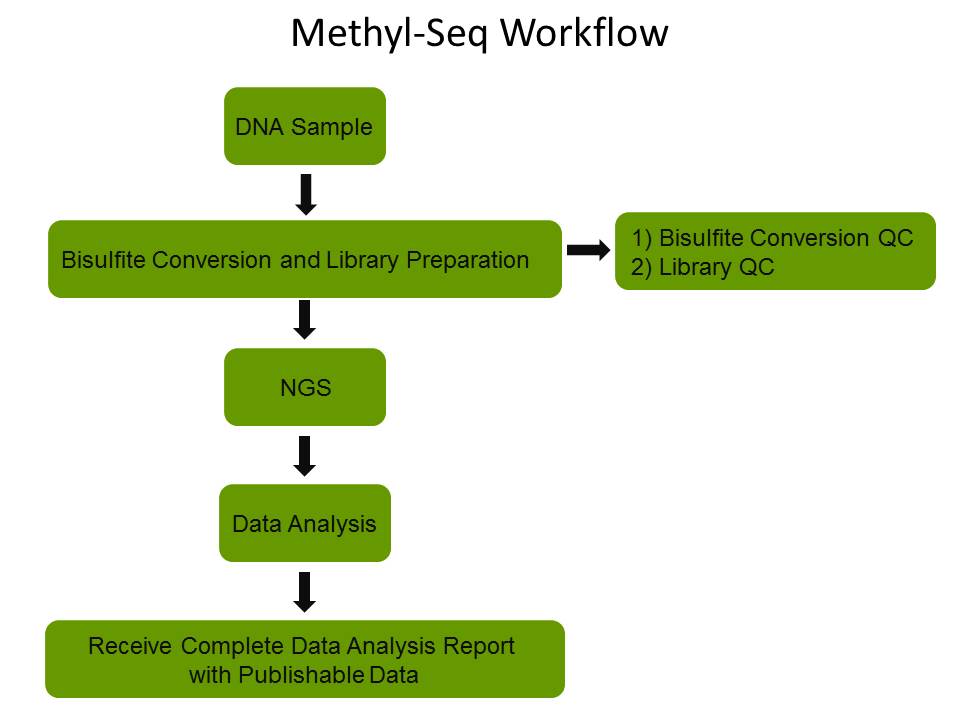
- Epigentek’s Methyl-Seq is a complete service pipeline beginning with your DNA sample through to deliverables of publishable data. Each step is carefully executed by our scientific team in order to produce reliable, high quality data which is fully customizable to meet your research needs.
-
- Bismark Mapping aligns bisulfite treated sequences to a genome of interest and will output comprehensive methylation data that can be visualized in a genome viewer or used for further analysis.
-
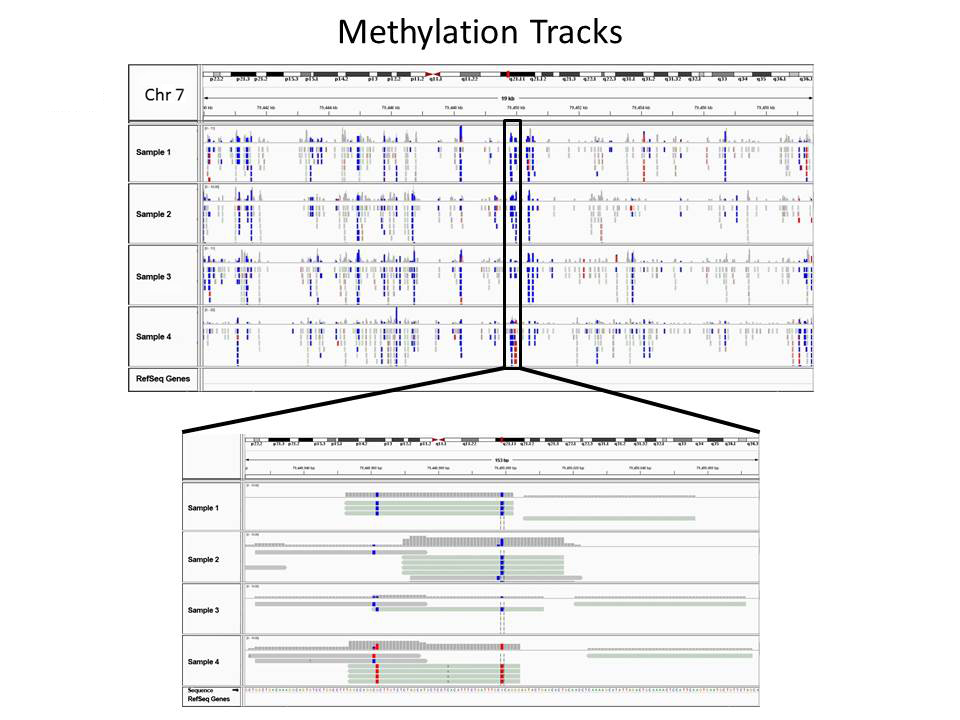
- Read alignment views of Methyl-Seq data at 19 kb and base pair resolution in chromosome 7 using Integrative Genomics Viewer (IGV). The data shows CpG methylation differences for treated and control samples. Control samples are unmethylated (blue) while treated samples are methylated (red).
-
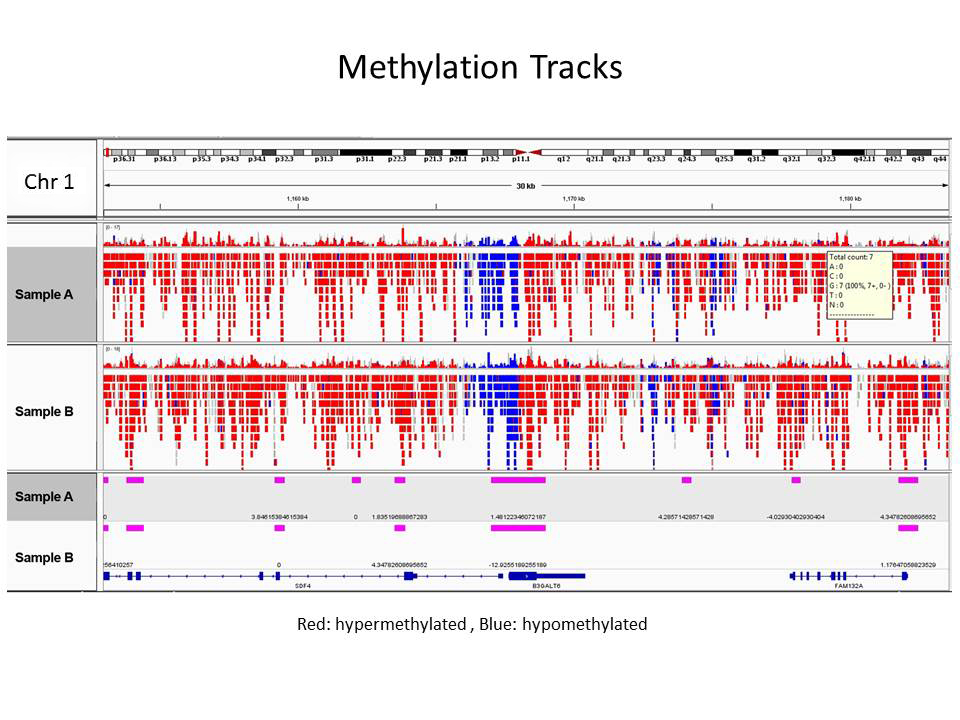
- Methyl-seq data tracks aligned to a 30 kb region of chromosome 1 show unmethylated (blue) and methylated (red) areas and the corresponding gene regions in treated and control samples.
-
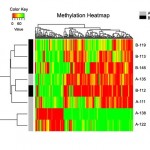
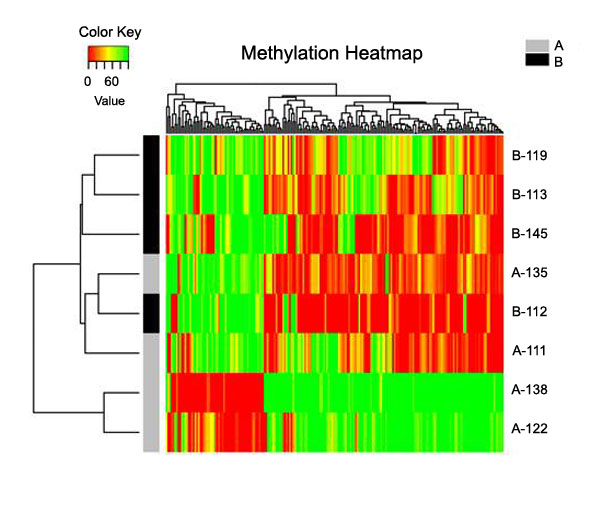
- The Methylation Heatmap offers statistical grouping and visualization of samples based on DNA methylation levels of CpG sites. Green = 100% methylated; Red = 0% methylated.
-
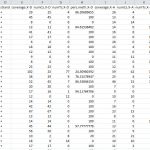
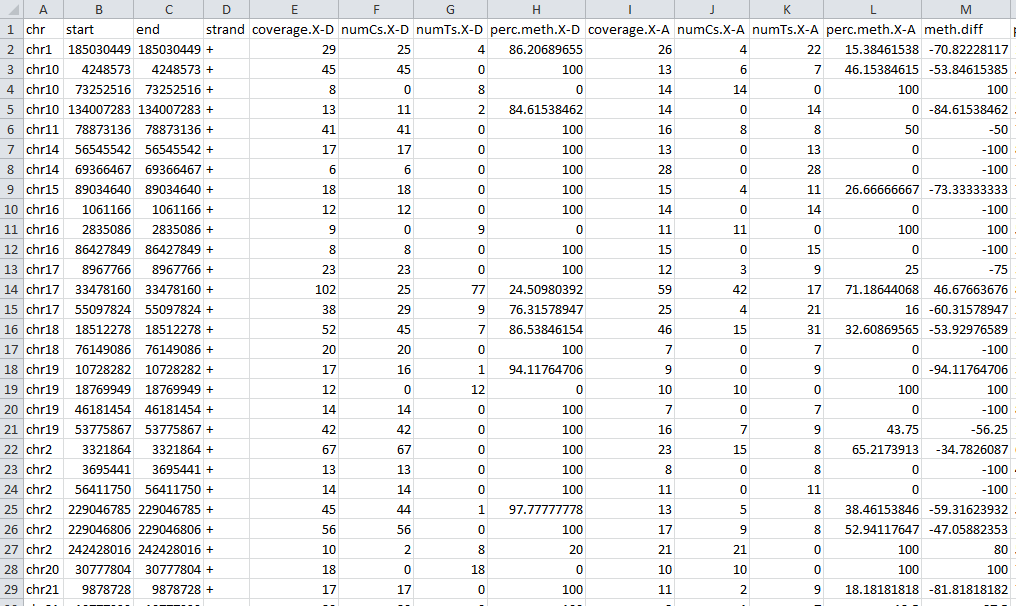
- Results Tables provide information about individual CpG sites and the frequency of methylation in addition to differential methylation analysis results. For each particular base, the methylation difference value is given along with methylation status as hyper- or hypo- methylated, as well as the chromosomal position and pvalue.
-
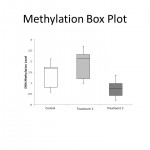
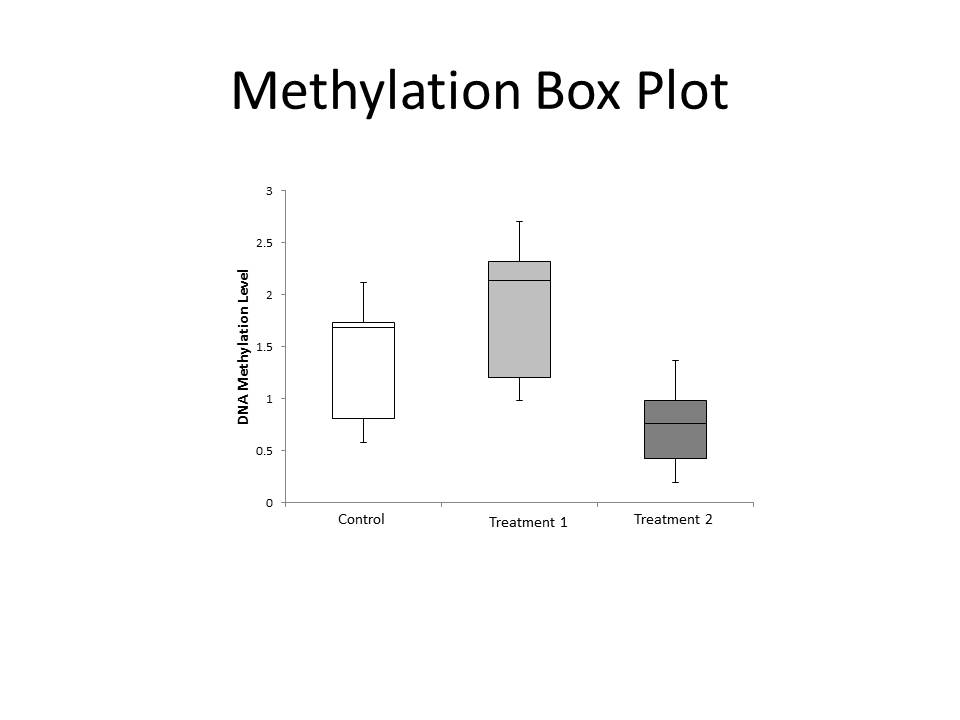
- A boxplot of DNA methylation is a useful graph to visualize and compare differences in DNA methylation levels between sample groups. In this example, treatment 1 results in hypermethylation compared to control, whereas treatment 2 results in hypomethylation. The average methylation level for each group, as well as distribution of methylation within a group is also shown.
-
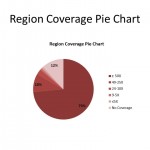
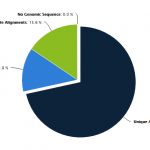
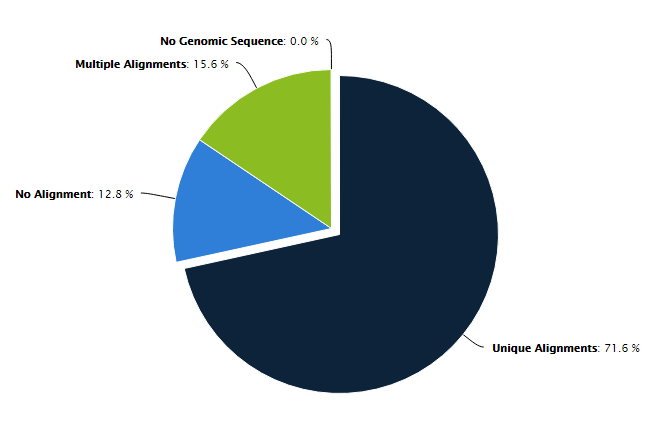
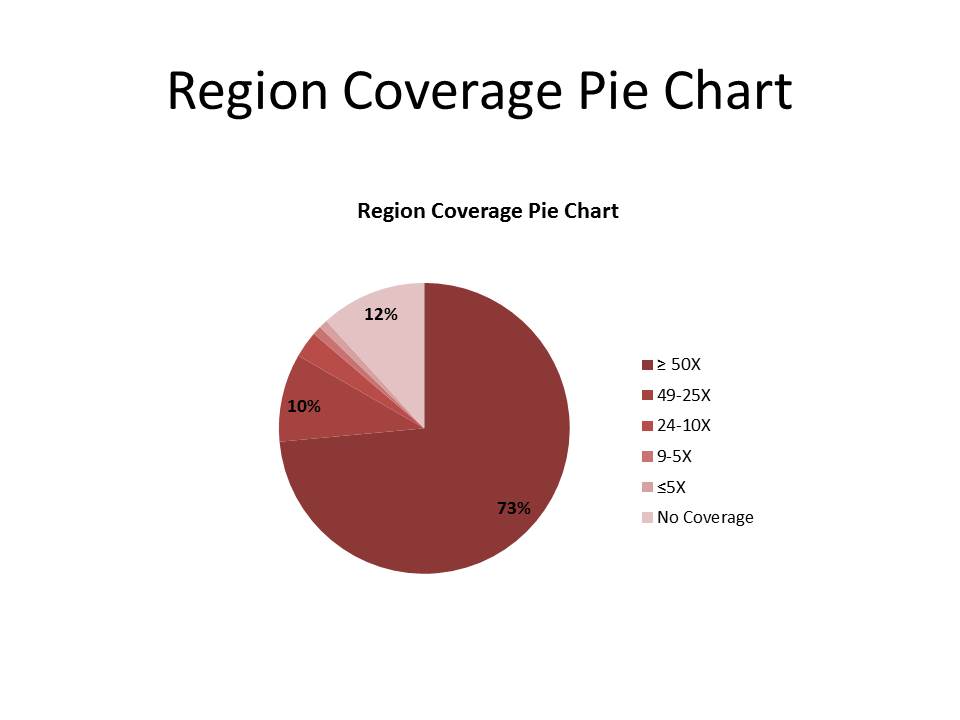
- Region Coverage Pie Charts allow you to visualize the depth of sequencing coverage for any genomic region. Higher coverage may be necessary when looking at rare transcripts or to obtain more information about a particular genomic region. Greater coverage also provides more reliable, statistically significant data.
-
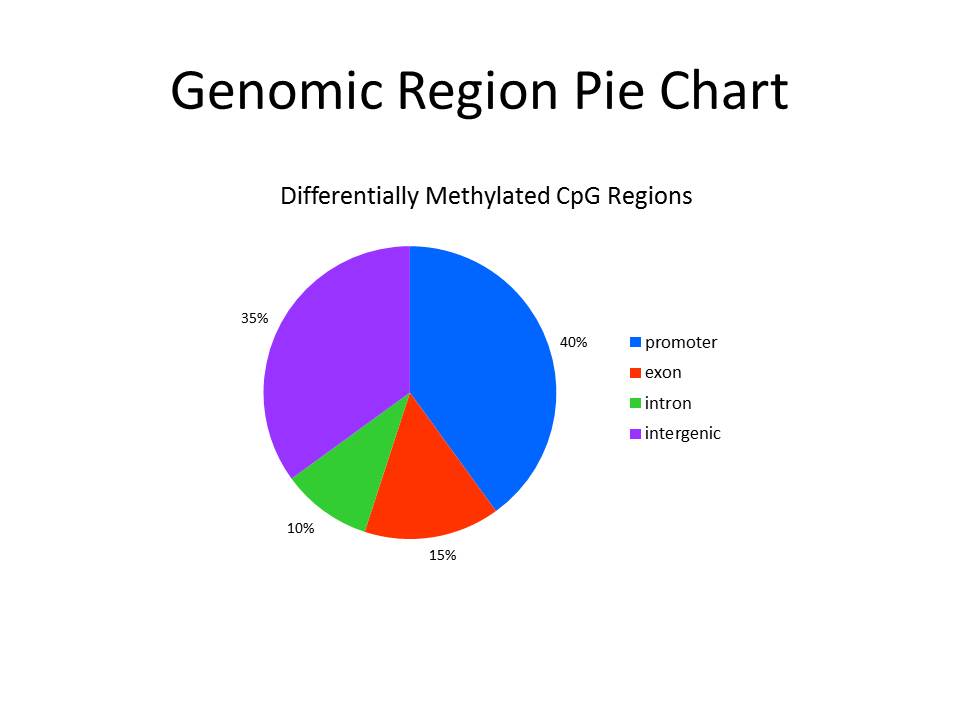
- Quickly assess the genomic distribution of CpG’s in your samples. The Genomic Region Pie Chart shows the percent of differentially methylated CpG’s mapping to specific regions of the genome (promoter, exon, intron and intergenic). A similar graph can be generated for individual samples showing the percent of CpG’s mapping to specific regions.
-
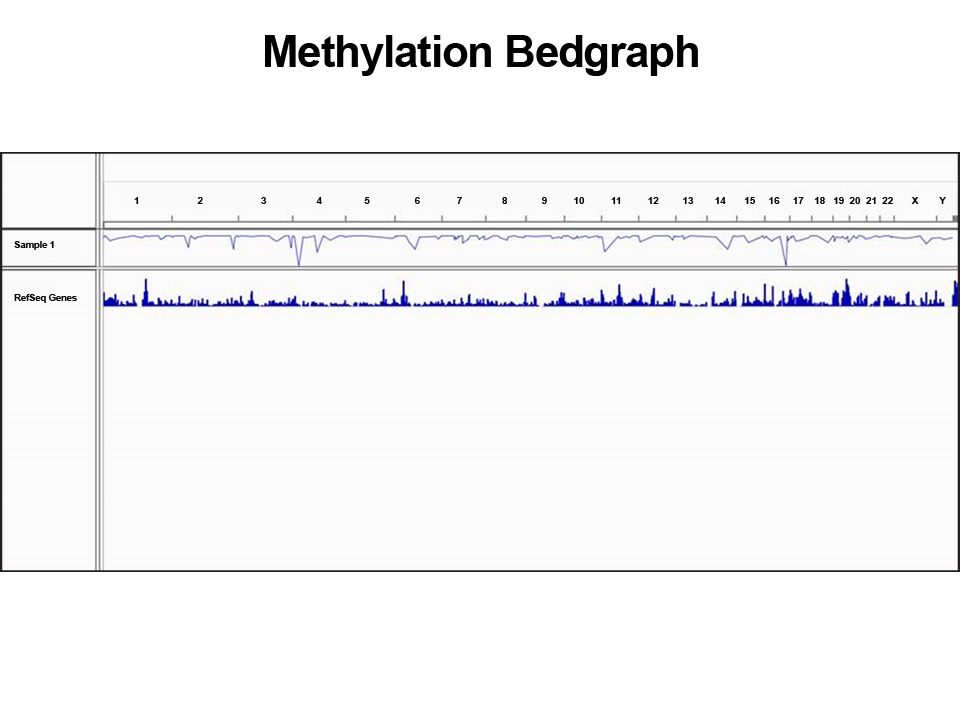
- The Methylation Bedgraph allows quick visual comparison of DNA methylation for each chromosome in the genome.
Sample Requirements
We currently accept DNA, cell, and tissue samples for our bisulfite sequencing Methyl-Seq service. Proper sample preparation along with the appropriate quality control methods on your end will allow the greatest chance for assay success. Please follow all guidelines for sample requirements, packaging and labeling, and shipping which are outlined on the Submission Instructions page.
Talk to a Scientist

Want more information on our bisulfite sequencing (Methyl-Seq) service or interested in customizing your research project? We’re here to help! Get in touch with one of our highly knowledgeable epigenetic services experts by calling toll-free at 1-877-374-4368 or emailing services @ epigentek.com.